l. Visualize Results
In this section, the results of the job just run will be visualised using NCL.
-
If not still connected, connect to the Head node via DCV, following instructions from part h. Connect to the Cluster
-
Install NCL using:
sudo yum install -y ncl
- Some of the default arguments for NCL need to be filled. Now that it has been installed, this can be done by sourcing the
.bashrcfile:
source ~/.bashrc
We will also set our default NCL X11 window size to be 1000x1000.
cat << EOF > $HOME/.hluresfile
*windowWorkstationClass*wkWidth  : 1000
*windowWorkstationClass*wkHeight : 1000
EOF
- In a terminal navigate to the WRF run directory.
cd /shared/conus_12km
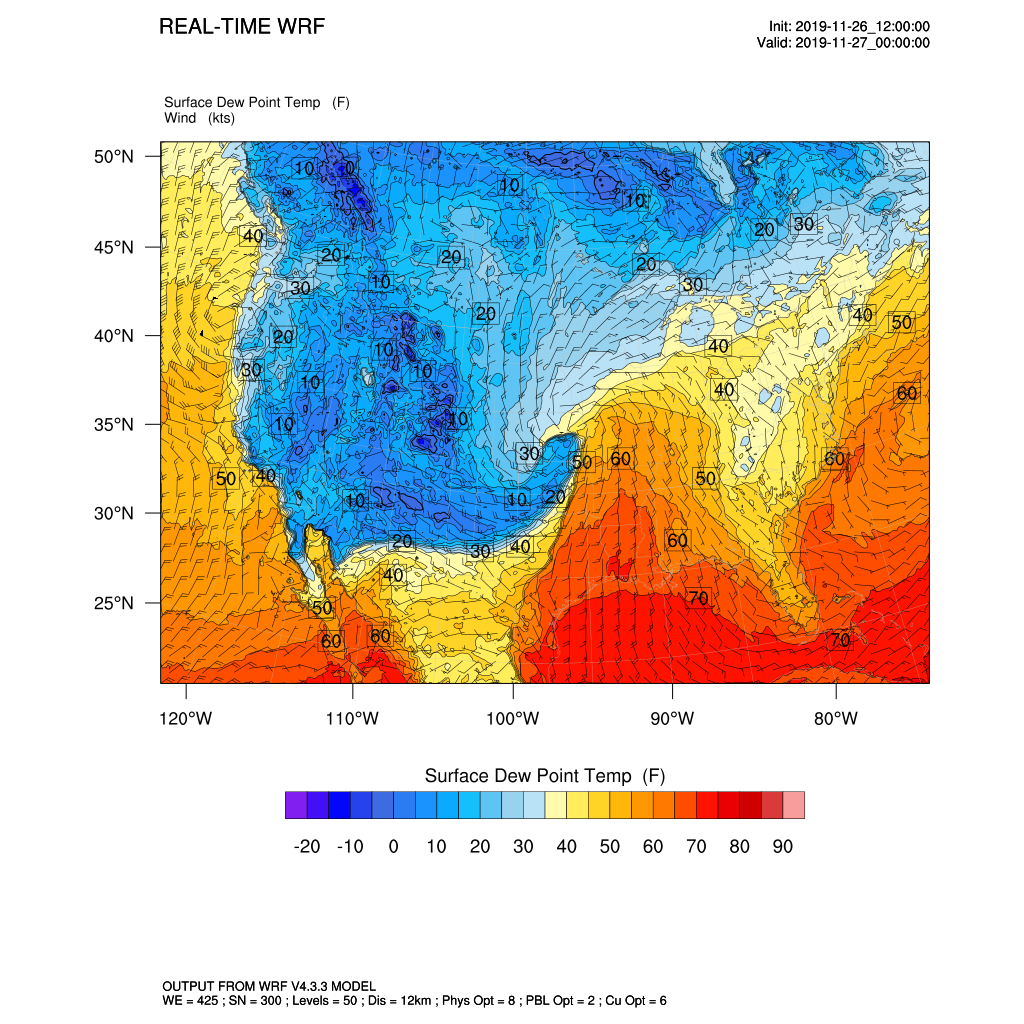
- The provided
ncl_scripts/surface.nclscript will generate two plots of surface fields at valid time 2019-11-27 00:00. Use the space bar to advance to the next plot.
ncl ncl_scripts/surface.ncl
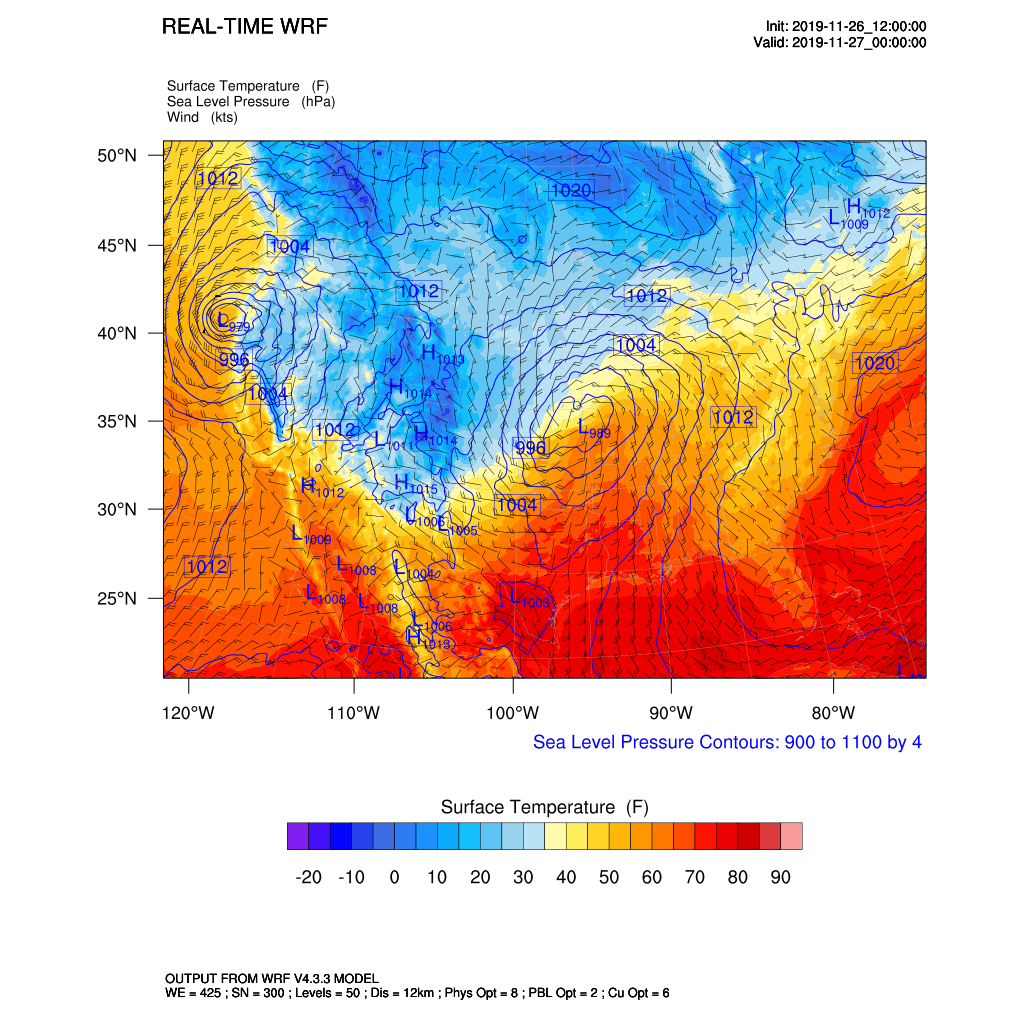
Use the space bar to advance to the next plot.
- Generate a vertical profile of relative humidity (%) and temperature (K).
ncl ncl_scripts/vert_crossSection.ncl
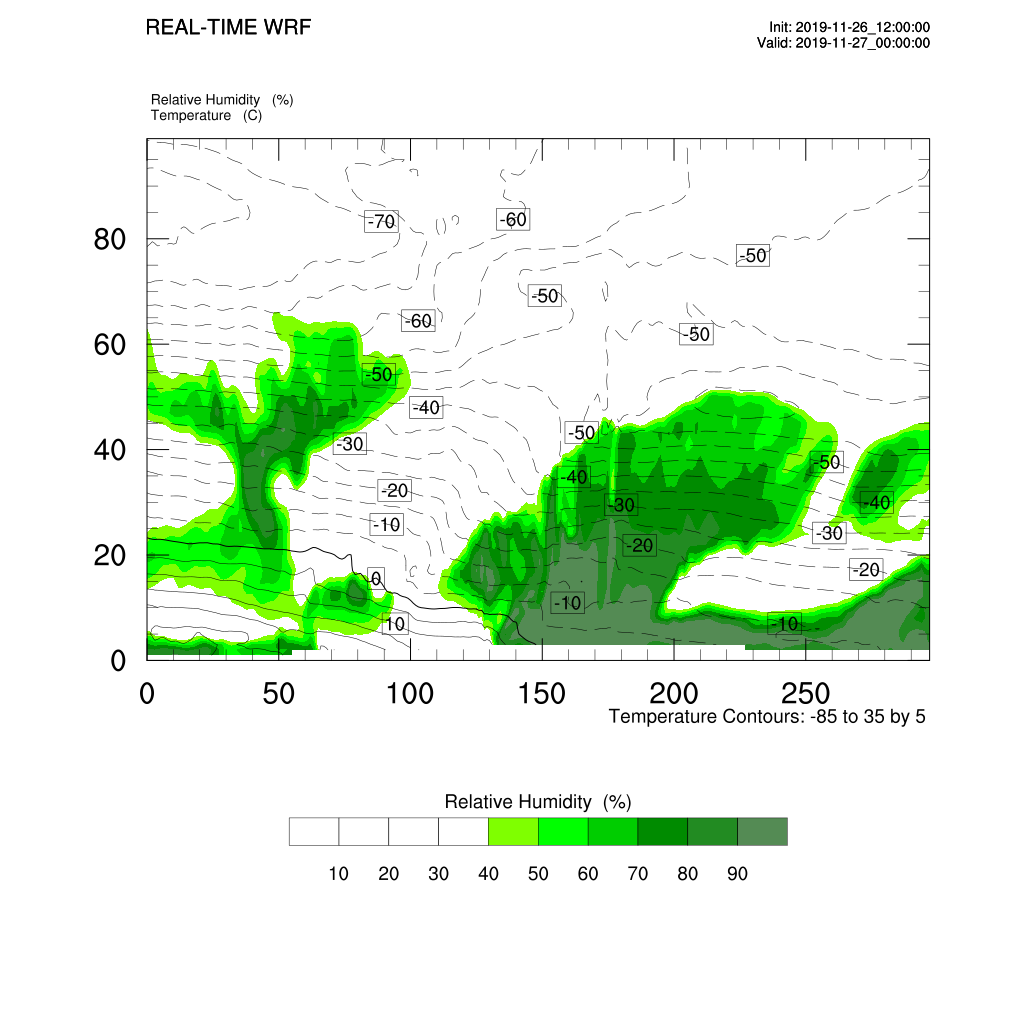
Again, use the space bar to advance beyond the current plot.