h. View Metrics with CloudWatch
In this step, you visualize the metrics related to your Amazon FSx for Lustre file system using CloudWatch. You can graph several metrics such as the throughput and IOPs. You can also create alarms or display more evolved metrics.
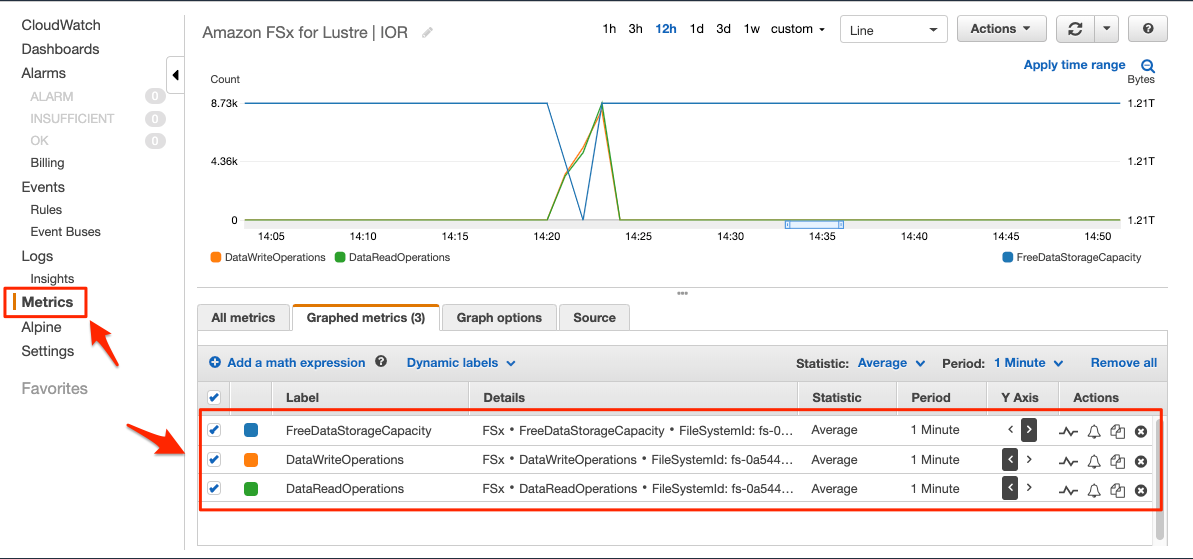
This example looks at the IOPS and free space on the file system as shown in the image below.
To produce a similar graph, follow these steps:
- In the AWS Management Console, in the search field, search for and choose Amazon FSx. Then, select File systems. Select file system (you may need to click on the three bars on the left panel to see this).
- Take note of your file system ID, it should be similar to fs-0a5444e4841233.
- In the AWS Management Console, in the search field, search for and choose CloudWatch. In the CloudWatch console choose Metrics/All Metrics, then FSx.
- Select File System Metrics and tick these selection boxes with the same ID as noted
- FreeDataStorageCapacity,
- DataWriteOperations, and
- DataReadOperations.
- Click on the Graphed metrics tab, like shown above. Set the FreeDataStorageCapacity to be displayed based on the right Y Axis (like in the screenshot above).
If you want, you can add this graph to a dashboard or build additional metrics as discussed here. In addition, you can set alarms to send notifications on events, such as low storage capacity or high bandwidth utilization. Those notifications can be used to trigger a Lambda function to create and attach a larger file system to your EC2 instances using CloudWatch Events or to send you an email with information about your environment status.